What is model interpretability?
Models are interpretable when humans can readily understand the reasoning behind predictions and decisions made by the model. The higher the interpretability of a machine learning model, the easier it is for someone to comprehend why certain decisions or predictions have been made. In this blog we see Shap library.
List of Python Libraries for Interpreting Machine Learning Models
- Local interpretable model-agnostic explanations (LIME) (https://github.com/marcotcr/lime)
- Shapley Additive explanations (SHAP)
- ELI5 (https://eli5.readthedocs.io/en/latest/overview.html)
- Yellowbrick (https://www.scikit-yb.org/en/latest/)
- Alibi (https://github.com/SeldonIO/alibi)
- Lucid (https://github.com/tensorflow/lucid)
SHAP (Shapley Additive explanations)

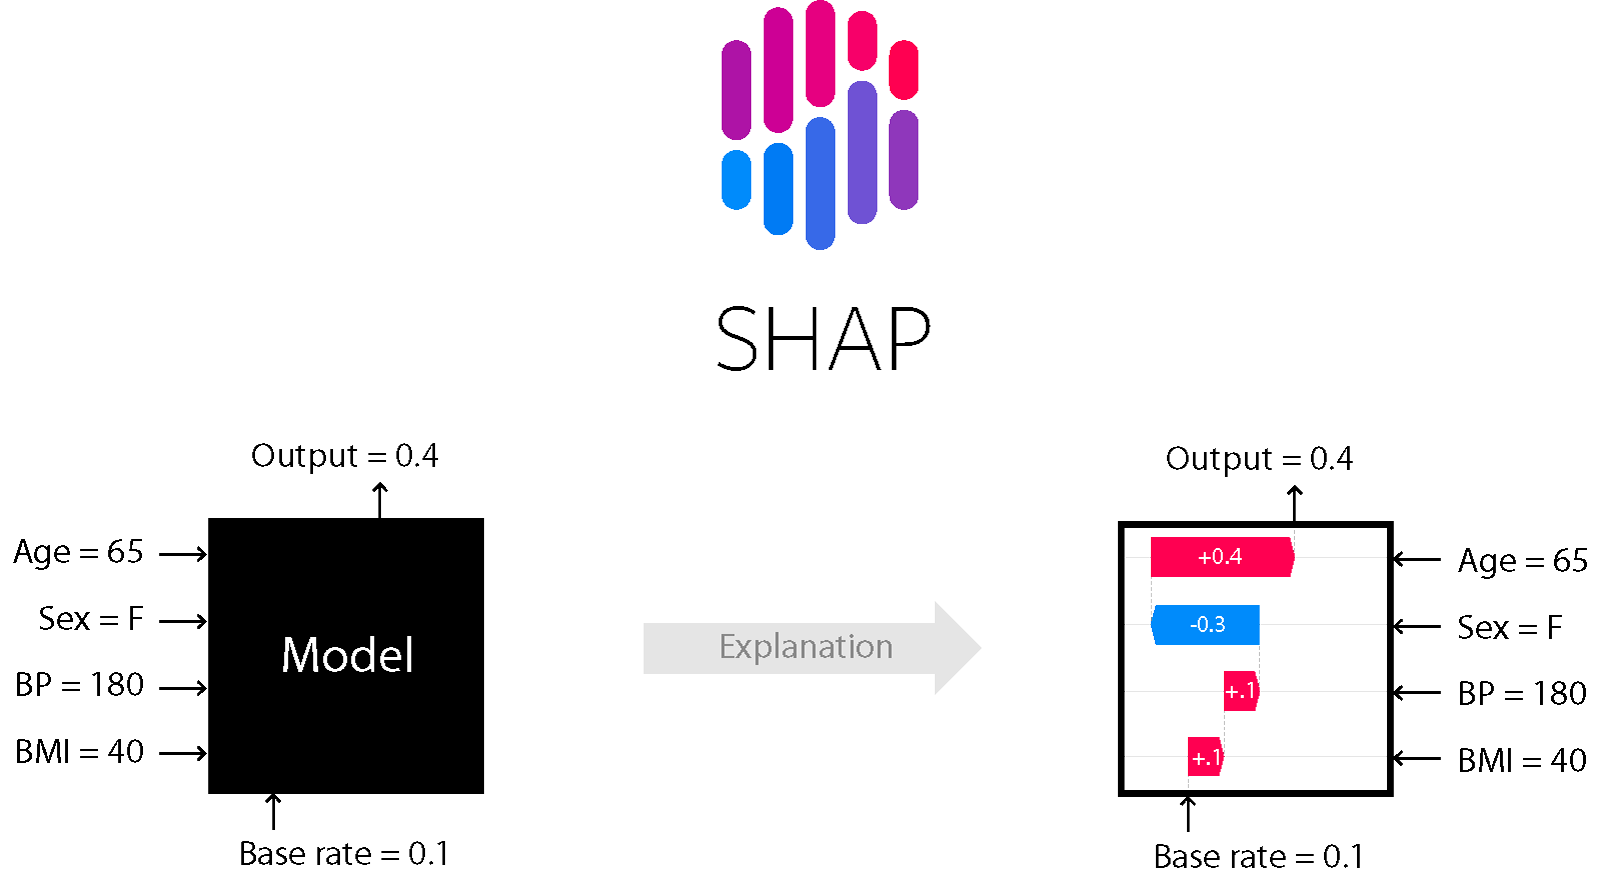
Shap is a popular library for machine learning interpretability. Shap explain the output of any machine learning model and is aimed at explaining individual predictions.
Install Shap library
- pip install shap
Example
Import all necessary library first
import pandas as pd
import numpy as np
import shap
from sklearn.datasets import load_breast_cancer
from sklearn.model_selection import train_test_split
from sklearn.ensemble import RandomForestClassifier
After importing all library then load data frame In this dataset 569 rows and 31 columns are.
cancer_data = load_breast_cancer()
df = pd.DataFrame(data = cancer_data.data, columns=cancer_data.feature_names)
df['target'] = cancer_data.target
df.shape
lets split data and train the model
X = df.iloc[:,:-1]
Y = df.iloc[:,-1:]

X_train, X_test, Y_train, Y_test = train_test_split(X, Y, test_size=0.2, random_state=42)

model = RandomForestClassifier(n_estimators=100,random_state=42)
model.fit(X_train, Y_train)
change visualization color pass plot_cmap parameter in force_plot.
# Need to load JS visualization in the notebook
shap.initjs()
# explain the model's predictions using SHAP values
explainer = shap.TreeExplainer(model)
shap_values = explainer.shap_values(X)
# visualize the first prediction's explaination with default colors
shap.force_plot(explainer.expected_value[1], shap_values[1][0,:], X.iloc[0,:])
# visualize the first hundred prediction's explaination with default colors
shap.force_plot(explainer.expected_value[1], shap_values[1][:100,:], X.iloc[:100,:])
# plot the global importance of each feature
shap.summary_plot(shap_values, X)
# plot the importance of a single feature across all samples
for name in X_train.columns:
    shap.dependence_plot(name, shap_values[1], X)
For more refer below link:
- https://pytechie.com/
- Welcome to the SHAP documentation — SHAP latest documentation
- https://shap.readthedocs.io/en/latest/example_notebooks/tabular_examples/tree_based_models/Front%20page%20example%20%28XGBoost%29.html
